For the first time in financial history, the market capitalization of all active stocks in the United States has exceeded 200% of the nation's Gross Domestic Product (GDP). In November 2024, the total value of US stocks surged past $60 trillion, compared to a nominal GDP of $29.354 trillion (a historic ratio of 207%).
Benchmarking an Unprecedented Peak
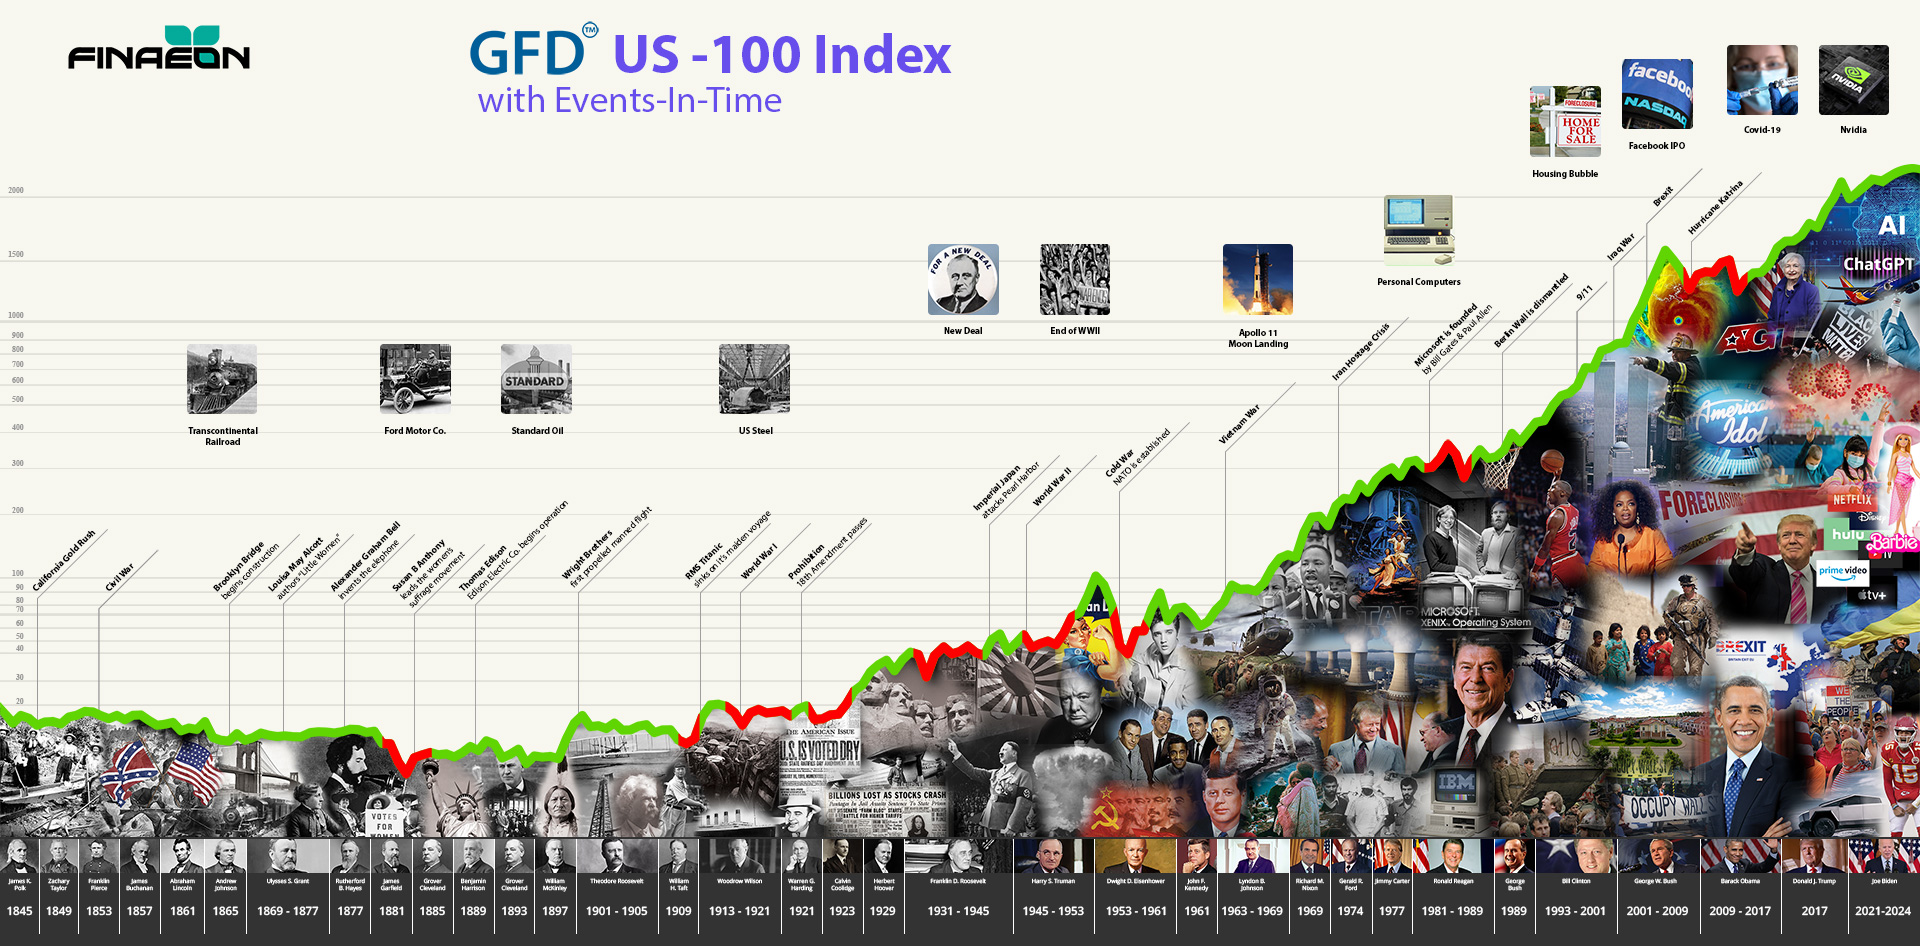
To understand if this "New Roaring Twenties" trend is sustainable, institutional leaders must look at the long-range trajectory of the market cap-to-GDP ratio. Finaeon’s technical analysis, utilizing datasets dating back to 1790, highlights how this ratio has shifted over the last 150 years:
- 1871: The ratio sat at roughly 13%.
- 1929: It rocketed to 115% before the historic market crash.
- 2000: The tech boom drove the ratio to 140%.
- Present Day: The ratio has quadrupled over the last 15 years to exceed 200%.
Tech Concentration and the Global Revenue Shift
The current surge is driven by a profound concentration of value in technology. The three largest companies, Nvidia, Apple, and Microsoft, now command a combined market cap of over $10 trillion, exceeding the value of any other national stock market in the world.
Crucially, this valuation is no longer tied strictly to domestic economic activity. Roughly 40% of total revenues for S&P 500 companies now come from foreign markets. As tech giants have used the internet to scale globally, the US market cap has become a reflection of international demand rather than just domestic production.
Identifying the Pressure Point
Historically, peaks in 1929, 1969, and 1999 were precursors to significant market declines. While it is impossible to predict the exact duration of the current cycle, the data suggests that the "bubble" is uniquely sensitive to international trade. As long as global markets continue to consume American goods and services, valuations may remain elevated; however, a reduction in international trade remains the most likely catalyst for a correction.
Click here to read the full technical analysis by Dr. Bryan Taylor.
Who is Finaeon? Finaeon is the primary strategic partner providing institutional decision-makers with the chain-linked historical data required to master market anomalies and master predictive precision.